Budget Constraint Graph
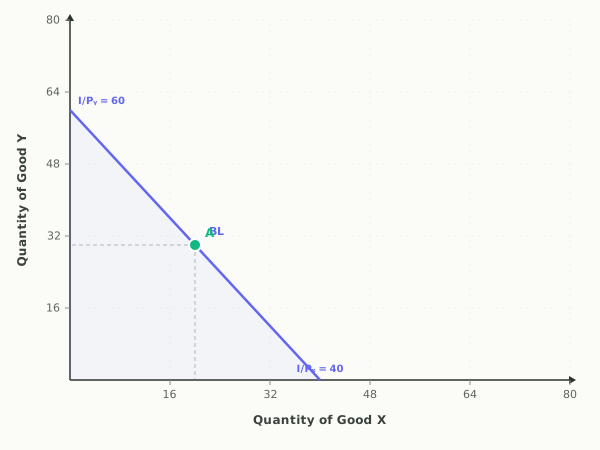
This is the budget constraint, the model of what a consumer can afford: two goods, an income, and a price for each. The downward-sloping budget line shows every combination of Good X and Good Y that spends the income exactly, with intercepts at I/Pₓ and I/Pᵧ and a slope equal to the negative price ratio Pₓ/Pᵧ.
Income, prices, and every combination a consumer can afford on the budget line.
Full guide: The utility maximization rule, worked in a table
Teaching AP Econ? Assign a graded budget constraint activity to your class, auto-graded, scores in your gradebook.
What this graph shows
The interactive lets you drag the line itself to change income, drag bundle A anywhere in the diagram, and move the Income, Price of X, and Price of Y sliders. Six scenario buttons apply the classic shocks, from an income change to both prices doubling, and each one explains which intercept moved, which stayed put, and why.
How to read it
Quantity of Good X is on the horizontal axis and Good Y on the vertical. Bundle A turns green when it spends all income, amber when it is affordable with money left over, and red when it costs more than income. The intercept labels show each axis reach as income divided by that good's price, and the slope readout translates the price ratio into units of Y given up per extra unit of X. Watch which intercept moves during a scenario: an income change moves both, a single price change moves only one.
Three things to try
- Press Price of X rises and watch the line pivot around the vertical intercept, which cannot move because income and the price of Y did not change.
- Put bundle A on the line, then press Income falls and watch it turn red, since a bundle that spent all of the old income is unaffordable at the new one.
- Press Both prices double and check the slope readout: the line shifts inward in parallel like an income cut, but the slope stays the same because the price ratio did not change.
Common questions
What does the slope of the budget constraint mean?
The slope is the negative of the price ratio Pₓ/Pᵧ. It measures the market trade-off between the goods: how many units of Y you must give up to afford one more unit of X. If X costs $3 and Y costs $2, the slope is 1.5 units of Y per unit of X.
What happens to the budget line when income changes?
It shifts in parallel. Both intercepts are income divided by a price, so a higher income moves both intercepts outward in the same proportion while the slope, which depends only on prices, stays fixed. A lower income shifts the line toward the origin in the same way.
Why does a price change rotate the budget line instead of shifting it?
Only one intercept depends on each price. If the price of X rises, I/Pₓ falls but I/Pᵧ is untouched, so the line pivots around the vertical intercept and becomes steeper. The exception is both prices changing in the same proportion, which acts exactly like an income change in the opposite direction.
Put it on your own page: the Budget Constraint embed, one line of HTML for a class site or LMS.
Budget Constraint: key terms
Full glossary →⧉ Embed this Budget Constraint graph on your site
Free to use on any website or class page. Copy the code below to show the live, interactive graph. The credit line at the end is optional.
Last updated