Circular Flow Diagram
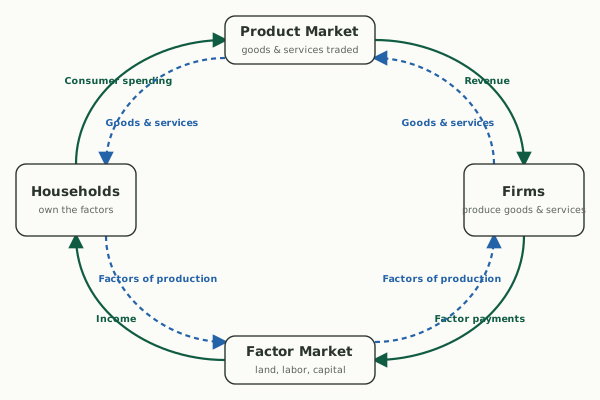
A circular flow diagram shows how money and real resources move between households and firms through two markets. Households sell the factors of production (land, labor, capital, and entrepreneurship) to firms in the factor market, then use that income to buy goods and services in the product market. Money runs one way around its loop and goods, services, and factors run the other way around theirs, so every dollar of spending becomes a dollar of someone's income.
Money and real flows between households, firms, and both markets, with an optional government sector.
Full guide: The circular flow model, diagram and leakages
Teaching AP Econ? Assign a graded circular flow activity to your class, auto-graded, scores in your gradebook.
Run it as a class activity: Circular Flow Activity: A Full Lesson With or Without Devices
What this graph shows
This interactive starts with the simple two-sector circular flow diagram: a solid money loop and a dashed real loop, with arrowheads and moving dots showing direction. You can hide either loop, switch on a government sector that collects taxes, pays transfer payments, and buys goods and services, and click any single flow to highlight it and read a plain-English explanation below the diagram.
How to read it
Households sit on the left, firms on the right, the product market at the top, and the factor market at the bottom. Follow the solid money loop clockwise: consumer spending goes from households into the product market and reaches firms as revenue, then factor payments (wages, rent, interest, and profit) go from firms through the factor market and reach households as income. The dashed real loop runs counterclockwise: firms supply goods and services through the product market to households, and households supply factors of production through the factor market to firms. With the government sector on, a Government box appears in the center: taxes flow in from households and firms, transfer payments flow back to households along the lower arrow between Government and Households, and government purchases flow up from Government into the product market.
Three things to try
- Turn off Money flows so only the dashed real loop remains, then turn money back on and turn off Real flows, and notice the two loops always run in opposite directions.
- Click the Factor payments arrow to highlight it and dim every other flow, then read the explanation of wages, rent, interest, and profit below the diagram.
- Switch on Government sector, click the lower arrow running from Government back to Households (transfer payments) and then the arrow from Government up to the Product Market (government purchases), and compare the two explanations to see why government purchases count in GDP while transfers do not.
Common questions
What does the circular flow diagram show?
It shows how money and resources circulate through an economy. Households supply land, labor, capital, and entrepreneurship to firms in the factor market and receive income, then spend that income on the goods and services firms sell in the product market. The money flow and the real flow form two loops that run in opposite directions.
What are the two markets in the circular flow diagram?
The product market, where households buy the goods and services firms produce, and the factor market, where firms hire the land, labor, capital, and entrepreneurship that households own. Households are buyers in the product market and sellers in the factor market, and firms are the reverse.
What flows in the opposite direction to money in the circular flow diagram?
The real flows do: goods and services, and the factors of production. Money moves from households to firms as spending and back to households as factor payments, while goods and services move from firms to households and factors of production move from households to firms.
How is the circular flow diagram used in macroeconomics and microeconomics?
In macroeconomics it shows why total spending equals total income, which is why GDP can be measured either way, and the government sector adds taxes, transfer payments, and government purchases. In microeconomics it shows how the product market and the factor market link households and firms. The simple version with only households and firms is the two-sector model, which is where this interactive starts.
Put it on your own page: the Circular Flow embed, one line of HTML for a class site or LMS.
Circular Flow: key terms
Full glossary →Last updated