Price Elasticity of Demand Graph
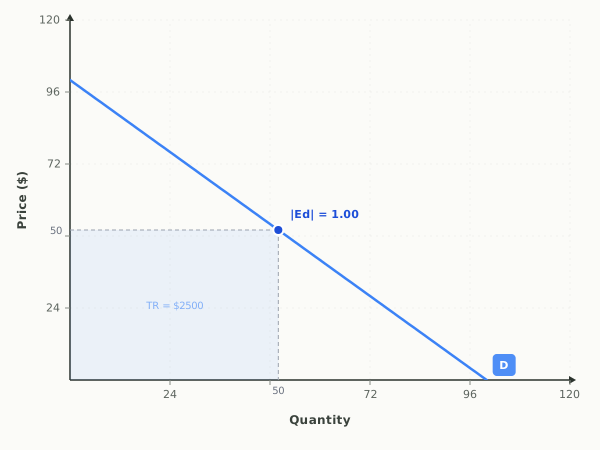
A price elasticity of demand graph plots one straight-line demand curve that is elastic on its upper half, unit elastic at its midpoint, and inelastic on its lower half. It shows how responsive the quantity buyers want is to a change in price, and it ties that responsiveness directly to total revenue, the shaded rectangle equal to price times quantity.
Price elasticity of demand, total revenue, and elastic vs. inelastic ranges.
Full guide: Elastic vs inelastic demand, explained
Teaching AP Econ? Assign a graded elasticity activity to your class, auto-graded, scores in your gradebook.
Run it as a class activity: Price Elasticity Classroom Activities for AP Microeconomics
What this graph shows
The interactive gives you two sliders. Demand Slope changes how steep or flat the curve is, from steep and inelastic to flat and elastic. Price Point moves a marker up and down the same curve. As you move either one, the graph reports the elasticity value, labels the point as Elastic, Inelastic, or Unit elastic, and redraws the revenue rectangle so you can watch total revenue rise or fall.
How to read it
Price is on the vertical axis and quantity on the horizontal. The blue dot marks the price and quantity you have chosen, with dashed reference lines dropping to each axis. The elasticity value labeled |Ed| appears next to the dot: greater than one is elastic, less than one is inelastic, and exactly one is unit elastic. The shaded rectangle from the axes out to the dot is total revenue, so watch its area, not just its shape, to see whether a price change helps or hurts revenue.
Three things to try
- Slide the Price Point high up the curve and read the elasticity, then slide it low, and notice the same curve is elastic near the top and inelastic near the bottom.
- Flatten the Demand Slope toward the elastic end and watch the elasticity value climb well above one at the same price.
- Move the Price Point until the label reads Unit elastic, and confirm the total revenue rectangle is at its largest area right at that point.
Common questions
How can the same demand curve be both elastic and inelastic?
On a straight-line demand curve, elasticity changes as you move along it. The upper section near high prices is elastic, the lower section near low prices is inelastic, and the exact midpoint is unit elastic, which you can verify by sliding the price point up and down.
How do you read total revenue on an elasticity graph?
Total revenue is the rectangle formed by the price on the vertical axis and the quantity on the horizontal axis, since revenue equals price times quantity. Compare the area of that rectangle at two different price points to see which price brings in more.
What does the total revenue test tell you here?
In the elastic range, cutting price raises total revenue because quantity rises more than price falls. In the inelastic range, cutting price lowers revenue, and revenue peaks exactly where demand is unit elastic.
What does a unit elastic point look like on a demand graph?
On a straight-line demand curve, the unit elastic point is the midpoint, where the elasticity |Ed| equals exactly one. Above it demand is elastic and below it demand is inelastic. Total revenue, the price times quantity rectangle, is at its largest at that point.
How do you show price elasticity of demand on a graph?
Draw a demand curve and pick a point on it; elasticity there compares the percentage change in quantity demanded with the percentage change in price. Through the same point, a flatter curve is more elastic and a steeper curve is more inelastic. Shading the price times quantity rectangle shows total revenue, which rises after a price cut only where demand is elastic.
Put it on your own page: the Elasticity embed, one line of HTML for a class site or LMS.
Elasticity: key terms
Full glossary →⧉ Embed this Elasticity graph on your site
Free to use on any website or class page. Copy the code below to show the live, interactive graph. The credit line at the end is optional.
Last updated