Tariff Graph (International Trade Diagram)
A tariff graph (an international trade diagram built on supply and demand) shows one country's market opened to a world price below its domestic equilibrium and then protected with a tariff that raises the domestic price and cuts imports. The blue domestic demand and red domestic supply curves set what the country would produce and consume on its own. The teal dashed line is the world price: when it sits below the domestic no-trade equilibrium, the country imports, because consumers buy at the lower world price while domestic firms supply less than consumers want, and imports fill the gap.
Comparative advantage, tariffs, quotas, and welfare effects.
Think you know when each curve moves? Try the draw-the-graph FRQ drills and get graded on it.
Related guide: Comparative advantage, with five worked examples
Teaching AP Econ? Assign a graded international trade activity to your class, auto-graded, scores in your gradebook.
Run it as a class activity: Tariffs and Trade Classroom Activities for AP Economics
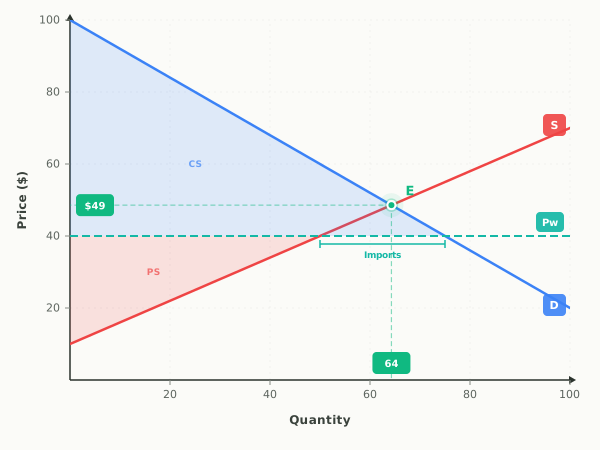
What this graph shows
Adding a tariff raises the price domestic buyers pay to the world price plus the tariff (the purple line). Domestic firms produce more, consumers buy less, and imports shrink. The graph shades the resulting areas: consumer surplus (blue), producer surplus (red), government tariff revenue (green), and two yellow deadweight-loss triangles. Those triangles capture the efficiency lost because the tariff pushes production to higher-cost domestic firms and prices some consumers out entirely.
How to read it
Price is on the vertical axis and quantity on the horizontal. At the world price, read domestic production where that line meets supply and domestic consumption where it meets demand; the distance between them is imports, marked by the teal bracket. Raise the tariff and the effective price line moves up, narrowing that gap. The green rectangle is the tariff revenue (tariff per unit times units imported), and the two yellow triangles are the deadweight loss from over-producing and under-consuming. The stats strip tracks the domestic price, import volume, and tariff revenue as you move the sliders.
Three things to try
- Lower the World Price slider and watch the import bracket widen, since a cheaper world price lets consumers buy more while domestic firms supply less.
- Raise the Tariff slider from zero and observe the effective price line climb, imports shrink, the green government-revenue rectangle appear, and two yellow deadweight-loss triangles open up.
- Push the tariff high enough that the effective price reaches the domestic no-trade equilibrium and confirm imports fall to zero, along with tariff revenue, because a prohibitive tariff shuts trade off entirely.
Common questions
Why does a country import when the world price is below its domestic price?
At the lower world price, domestic consumers want to buy more than domestic firms are willing to supply. Foreign producers fill that gap, so the quantity between domestic supply and domestic demand at the world price is imported.
Who wins and who loses from a tariff on this graph?
Domestic producers gain surplus and the government gains tariff revenue, but consumers lose more surplus than those two groups gain. The difference is the two yellow deadweight-loss triangles, representing a net loss to the economy.
What do the two deadweight-loss triangles represent?
The production-side triangle is the waste from shifting output to higher-cost domestic firms instead of cheaper foreign ones. The consumption-side triangle is the lost value from consumers who stop buying because the tariff raised the price. Together they measure the tariff's efficiency cost.
How does a tariff graph work?
Start with domestic supply and demand and a horizontal world price line below the domestic equilibrium; the gap between quantity demanded and quantity supplied at that price is imports. A tariff raises the domestic price to the world price plus the tariff (as long as that sum stays below the domestic equilibrium price; a tariff large enough to reach it stops imports entirely), so domestic output rises, consumption falls, and imports shrink. The rectangle of tariff times imports is government revenue, and the two triangles beside it are deadweight loss.
Watch a shock move this graph, step by step
- A Global Glut Pushes the World Price DownA global glut drives the world price lower, so imports widen, domestic producers supply less, and consumers gain more than producers lose.
- A Tariff Lands on ImportsA per-unit tariff lifts the price inside the country to the world price plus the tariff, so imports shrink, the government collects revenue, and two deadweight loss triangles open.
- A Trade Dispute Tariff Is RepealedA tariff left over from a trade dispute is removed, so the price inside the country drops back to the world price, imports widen, and the deadweight loss disappears.
- A Global Shortage Lifts the World PriceThe world price rises toward the domestic no-trade equilibrium, so domestic producers expand along their supply curve and the import gap narrows.
- A Demand Boom in an Import MarketDomestic demand shifts right while the world price holds still, so domestic production is unchanged and every additional unit consumed is imported.
Put it on your own page: the International Trade embed, one line of HTML for a class site or LMS.
Print it: International Trade drawing worksheet, the same shocks on blank axes, with an answer key.
International Trade: key terms
Full glossary →⧉ Embed this International Trade graph on your site
Free to use on any website or class page. Copy the code below to show the live, interactive graph. The credit line at the end is optional.
Last updated