Monopsony Graph (Labor Market With One Employer)
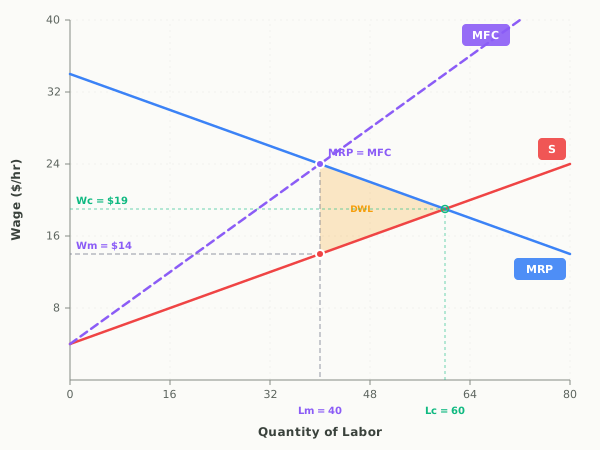
A monopsony graph shows a labor market with a single employer, such as the only hospital hiring nurses in a small town. Labor supply (red, S) slopes up, so the firm has to raise the wage to attract more workers, and it pays that higher wage to everyone it already employs. That makes the marginal factor cost of labor (purple dashed, MFC) greater than the wage, so MFC lies above the supply curve. Marginal revenue product (blue, MRP) is the firm's demand for labor.
A single employer: MFC above labor supply, hiring where MRP = MFC, and the wage read off supply.
On the AP exam: AP Micro 5.4 Monopsonistic Markets
Teaching AP Econ? Assign a graded monopsony activity to your class, auto-graded, scores in your gradebook.
What this graph shows
The monopsonist hires the quantity of labor where MRP = MFC, then pays the wage on the supply curve at that quantity. The green marker shows the competitive outcome, where MRP meets supply, so you can compare the two directly: the monopsony pays a lower wage and hires fewer workers, and the shaded triangle between them is the deadweight loss. A Minimum Wage tool lets you set a wage floor and see when it raises employment and when it creates unemployment.
How to read it
The wage per hour is on the vertical axis and the quantity of labor on the horizontal. Find the purple dot where MRP crosses MFC and go straight down to the horizontal axis for the monopsony quantity of labor, Lm. From that same quantity, stop at the red dot on the supply curve and go left to the vertical axis for the monopsony wage, Wm. The wage is never read at the height of the MRP = MFC crossing. The green circle where MRP crosses supply gives the competitive quantity and wage, Lc and Wc. With the default curves the monopsony hires 40 workers at $14 an hour, while a competitive market would hire 60 at $19.
Three things to try
- Start from the default curves and read both outcomes off the graph: 40 workers at $14 under monopsony against 60 workers at $19 under competition, with the MRP = MFC crossing sitting up at $24.
- Turn on Minimum Wage and set it to $17, between the monopsony wage and the competitive wage, and watch employment rise from 40 to 52 while the wage rises too. Then push it to $22, above the competitive wage, and see 24 workers left unemployed.
- Press the MRP arrow to shift labor demand right, as a higher product price or more productive workers would, and confirm the monopsony wage and employment both rise while staying below the competitive levels.
Common questions
Why is MFC above the labor supply curve in a monopsony?
A monopsonist pays every worker the same wage, so hiring one more worker means raising the wage for all the workers it already has. The cost of the extra worker is their wage plus those raises, which is more than the wage alone. With a straight-line supply curve, MFC starts at the same point and rises twice as fast.
How do you find the wage on a monopsony graph?
Find the quantity of labor where MRP = MFC, then go down from that quantity to the labor supply curve and read the wage there. The supply curve shows the lowest wage that attracts that many workers, and that is what the monopsonist pays. Reading the wage at the MRP = MFC intersection is the most common mistake.
How does a monopsony compare with a perfectly competitive labor market?
A competitive labor market settles where labor demand (MRP) equals labor supply. A monopsony hires fewer workers and pays a lower wage than that, and the wage it pays is below the MRP of the last worker hired. The jobs that would have existed under competition but do not under monopsony are a deadweight loss.
Can a minimum wage increase employment in a monopsony?
Yes, if it is set above the monopsony wage and no higher than the competitive wage. The firm then pays the minimum wage to each worker it hires, so its marginal factor cost equals that wage up to the supply curve, and it hires more workers than before. A minimum wage above the competitive wage makes the firm hire along its MRP curve and leaves some people who want a job without one.
Put it on your own page: the Monopsony embed, one line of HTML for a class site or LMS.
Monopsony: key terms
Full glossary →⧉ Embed this Monopsony graph on your site
Free to use on any website or class page. Copy the code below to show the live, interactive graph. The credit line at the end is optional.
Last updated