Perfect Competition Graph
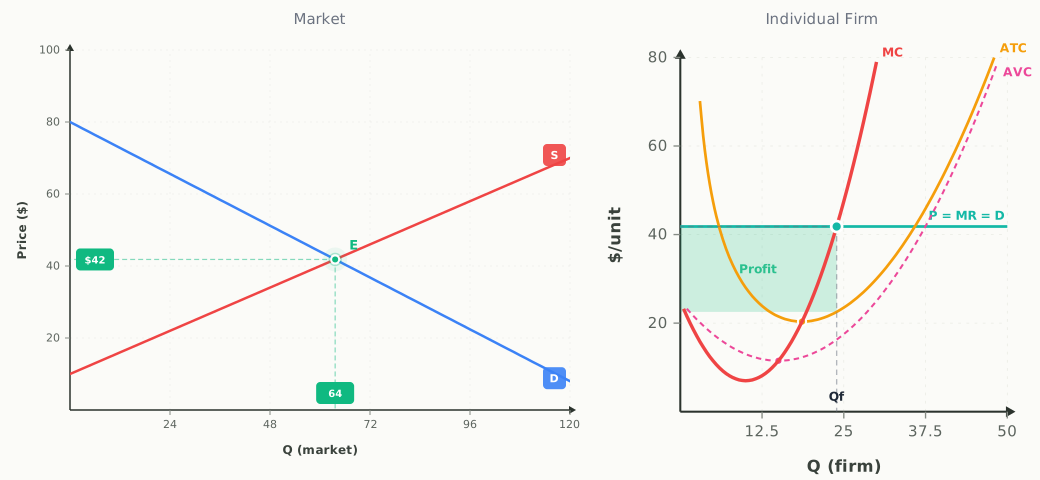
This is the two-panel perfect competition model, linking a whole market to one small firm inside it. The left panel is the market, with a downward demand curve and upward supply curve that set the going price. The right panel is a single price-taking firm, showing its marginal cost, average total cost, and average variable cost curves.
Price-taking firms, profit maximization, and long-run equilibrium.
Teaching AP Econ? Assign a graded perfect competition activity to your class, auto-graded, scores in your gradebook.
Run it as a class activity: Perfect Competition Classroom Activities for AP Microeconomics
What this graph shows
Shift market demand and supply with drag or arrow buttons to move the market price. That price becomes the flat P equals MR equals D line the firm faces, and you can drag the firm's cost curves or use the Firm Cost Level slider. The firm's output and profit or loss update as you change either panel.
How to read it
Both panels put dollars on the vertical axis and quantity on the horizontal; the market panel uses market quantity, the firm panel its own. Read the market price at the demand and supply intersection labeled E, then carry it across as the horizontal line the firm faces. The firm produces where that line crosses marginal cost, marked Qf. Compare the price line to average total cost at Qf: above ATC is a shaded profit, below ATC a shaded loss, and exactly on the ATC minimum is break-even.
Three things to try
- Press the S arrow to shift market supply right, watch the market price fall, and see the firm's horizontal price line drop until profit turns into a loss.
- Drag the firm's cost curves upward, or push the Firm Cost Level slider up, and observe the loss rectangle appear as average total cost rises above the price.
- Shift market demand right to raise the price, then confirm the firm produces more where the higher price line meets marginal cost.
Common questions
Why is the demand curve flat for a firm in perfect competition?
A single competitive firm is too small to affect the market price, so it can sell any quantity at the going price. That makes its demand a horizontal line where price, marginal revenue, and demand are all the same value, set by the market panel.
How do you tell if a competitive firm is making a profit or loss on the graph?
Compare the horizontal price line to the average total cost curve at the firm's output. If the price line sits above ATC there is a profit rectangle, if it sits below ATC there is a loss rectangle, and if it just touches the bottom of ATC the firm breaks even.
How does the market graph connect to the firm graph?
The market panel sets the price at its supply and demand intersection, and that exact price becomes the horizontal line the firm faces on the right. Change anything in the market and the firm's price line moves with it.
Put it on your own page: the Perfect Competition embed, one line of HTML for a class site or LMS.
Perfect Competition: key terms
Full glossary →⧉ Embed this Perfect Competition graph on your site
Free to use on any website or class page. Copy the code below to show the live, interactive graph. The credit line at the end is optional.
Last updated