EconLearn
Sandbox

Reserve Market Graph

Limited- and ample-reserves frameworks, open-market operations, and IORB.

Drag curves to shift · Toggle curves with the Show / Hide buttons · Use fullscreen for presentations

Teaching AP Econ? Assign a graded reserve market activity to your class, auto-graded, scores in your gradebook.
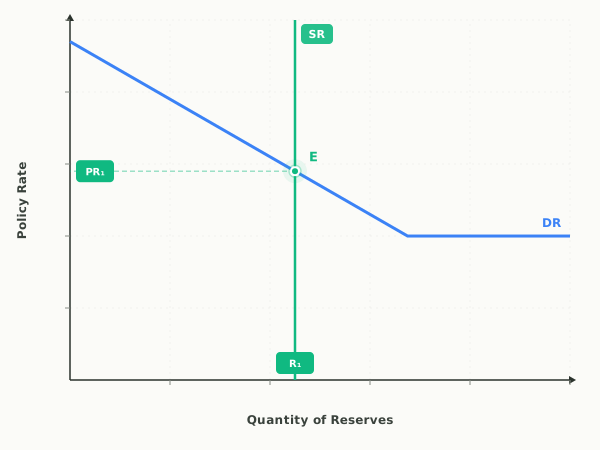
Reserve market graph: a vertical supply of reserves crossing the downward-sloping demand for reserves to set the policy rate in the limited-reserves framework, with the demand curve flattening at the interest rate on reserve balances (IORB)
The reserve market under limited reserves, where the supply of reserves sets the policy rate. Free to use on worksheets and slides: download the SVG, or drag the live version above to draw the case you need.

Put it on your own page: the Reserve Market embed, one line of HTML for a class site or LMS.

⧉ Embed this Reserve Market graph on your site

Free to use on any website or class page. Copy the code below to show the live, interactive graph. The credit line at the end is optional.

Last updated

AP® is a trademark registered by the College Board, which is not affiliated with, and does not endorse, EconLearn. International Baccalaureate®, AQA, Pearson Edexcel, and the textbook titles named on this site belong to their owners, who are not affiliated with and do not endorse EconLearn.