How do you read profit, break even, and loss on a firm's graph?
Find the quantity where marginal revenue equals marginal cost, then compare price to average total cost there: price above ATC means profit, equal means break even, below means a loss. A flat demand curve marks a price taking firm; a downward sloping one marks a firm with market power.
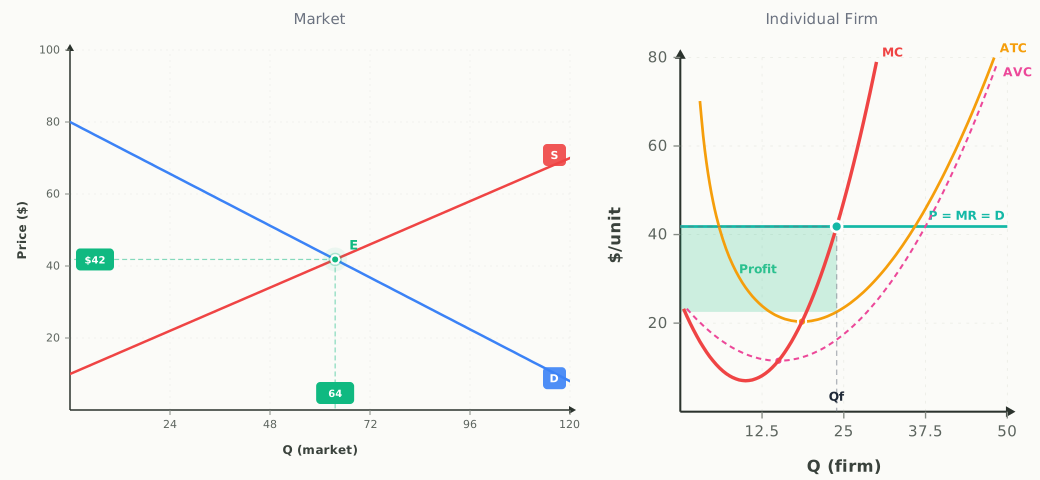
Every firm graph answers the same question the same way. First find the profit maximizing quantity, the output where the marginal revenue curve crosses the marginal cost curve. Trace straight up from that quantity to the demand curve to read off price, then trace up to the average total cost curve to read off ATC at that same quantity. The gap between price and ATC, multiplied by quantity, is total profit or total loss, drawn as a rectangle sitting on top of or below the ATC curve.
In the profit case, price sits above ATC at the MR equals MC quantity. Say MR equals MC at 100 units, price is 12 dollars, and ATC at 100 units is 8 dollars. Profit per unit is 12 minus 8, or 4 dollars, so total economic profit is 4 dollars times 100 units, or 400 dollars. On the graph that 400 dollar rectangle sits directly above the ATC curve, bounded by price on top and ATC on the bottom.
Break even looks almost the same except price and ATC meet exactly at the profit maximizing quantity. If MR equals MC at 80 units and both price and ATC are 10 dollars there, profit per unit is zero and total economic profit is zero. The firm still covers every explicit and implicit cost, including a normal return on the owner's time and capital, it just earns nothing above that. A loss flips the rectangle below the ATC curve: if MR equals MC at 60 units, price is 6 dollars, and ATC is 9 dollars, the firm loses 3 dollars per unit, or 180 dollars total.
A loss is not automatically a signal to close. Check price against average variable cost at that same quantity. If AVC at 60 units is 5 dollars, price of 6 dollars still covers variable cost with a dollar left over toward fixed cost, so the firm keeps producing in the short run despite the 180 dollar loss. Only when price falls below AVC, say AVC rises to 7 dollars while price stays at 6, does shutting down and producing zero units lose less money than staying open.
The shape of the demand curve tells you what kind of firm you are looking at before you even find MR equals MC. A flat, horizontal demand curve means the firm is a price taker in perfect competition: it can sell any quantity at the going market price, so demand and marginal revenue are the same horizontal line. A downward sloping demand curve means the firm has market power, as in monopoly, monopolistic competition, or oligopoly, and its marginal revenue curve sits below demand because selling one more unit forces the price down on every unit sold, not just the last one.
Go deeper
Related questions
- What does it mean when price equals average total cost on the graph?
- That quantity is the break even point. Economic profit is zero, but the firm is still covering every cost including a normal return on the owner's time and investment, so it keeps operating.
- How do you tell from the graph if a firm should shut down?
- Compare price to average variable cost at the profit maximizing quantity, not average total cost. If price is below AVC the firm loses less by producing zero units than by staying open, so it shuts down in the short run.
- How can you tell a firm has market power just from the graph?
- Look at the demand curve the firm faces. A flat, horizontal demand curve belongs to a price taking firm in perfect competition. A downward sloping demand curve belongs to a firm with market power, whose marginal revenue curve sits below that demand curve.
More questions answered
Last updated