How to Calculate a Shortage Under a Price Ceiling
A price ceiling shortage equals quantity demanded minus quantity supplied at the ceiling price, and only appears when the ceiling sits below equilibrium.
Full guide: Shortage vs surplus, with graphs
The Price Ceiling Shortage formula
Worked example: Price Ceiling Shortage
Demand is P = 20 − Q and supply is P = 4 + Q, so equilibrium sits at Q = 8, P = 12. A ceiling at $8 gives Qd = 20 − 8 = 12 and Qs = 8 − 4 = 4, so the shortage is 12 − 4 = 8 units.
Calculator
Enter linear demand and supply in price form and a ceiling price to get the shortage it creates.
The price at which quantity demanded would be zero.
The lowest price at which anything is supplied.
Quantity demanded minus quantity supplied at the ceiling price.
- Equilibrium price
- $12
- Equilibrium quantity
- 8
- Quantity demanded at ceiling
- 12
- Quantity supplied at ceiling
- 4
How to calculate Price Ceiling Shortage, step by step
- 1Check whether the ceiling binds. Compare the ceiling price to the equilibrium price. A ceiling set at or above equilibrium changes nothing, since the market was already willing to settle below it.
- 2Find quantity demanded at the ceiling price. Plug the ceiling price into the demand equation, or read straight across from the ceiling price to the demand curve.
- 3Find quantity supplied at the ceiling price. Plug the ceiling price into the supply equation, or read straight across from the ceiling price to the supply curve.
- 4Subtract. Shortage = quantity demanded − quantity supplied, both measured at the ceiling price, not at equilibrium.
Why the ceiling has to bind
A price ceiling is a legal maximum: nobody may charge more than it, but nothing stops the market from settling below it. That is the whole reason a ceiling above equilibrium does nothing. If equilibrium price is $12 and the ceiling is set at $16, sellers can still charge up to $12 without breaking any rule, so the market clears exactly where it would have anyway, at Q = 8. No shortage shows up because quantity demanded and quantity supplied are still equal at that price.
Only a ceiling below equilibrium forces a change. Buyers now want more than $8 worth of units, since that price is a discount from equilibrium, and sellers now want to supply less than they would at $12, since $8 barely covers their costs at higher quantities. The two curves stop meeting at the ceiling price, and the gap between them is the shortage.
A ceiling exactly at equilibrium is the boundary case: quantity demanded still equals quantity supplied, so the shortage is zero, but any further cut in the ceiling from that point opens a gap.
Working the numbers both ways
Take demand P = 20 − Q and supply P = 4 + Q. Setting them equal, 20 − Q = 4 + Q gives 2Q = 16, so Q = 8 and P = 12. That is the price and quantity the market would reach with no ceiling at all.
Now impose a ceiling at $8. Quantity demanded comes from the demand equation: Qd = 20 − 8 = 12. Quantity supplied comes from the supply equation: Qs = 8 − 4 = 4. The shortage is Qd − Qs = 12 − 4 = 8 units.
Compare that to a milder ceiling at $10, closer to equilibrium. Qd = 20 − 10 = 10 and Qs = 10 − 4 = 6, so the shortage is only 4 units. The lower the ceiling falls below equilibrium, the larger quantity demanded grows and the smaller quantity supplied shrinks, so the shortage widens on both ends at once.
Reading it off the graph instead of the equations
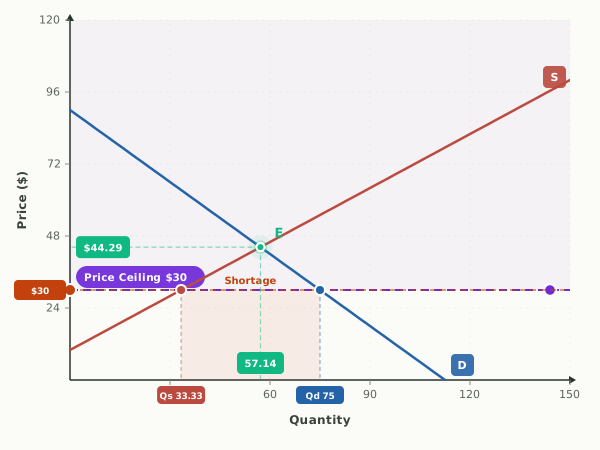
Free-response questions often hand you a drawn graph with no equations at all, and the method is the same picture the algebra was describing. Start at the ceiling price on the vertical axis and draw a horizontal line across the graph.
That line crosses the demand curve at one point and the supply curve at another. Drop straight down from each crossing to the quantity axis. The point under the demand crossing is quantity demanded; the point under the supply crossing is quantity supplied. Because the ceiling sits below equilibrium, the demand crossing lands to the right of the supply crossing, so quantity demanded is the larger number.
The shortage is simply the length of the quantity axis between those two points. Grading rubrics usually want that segment labeled directly on the graph, not just written as a number underneath, so mark both quantities and bracket the distance between them.
Where the marks are lost
The most common error is plugging the ceiling price into only one equation and stopping, which gives quantity demanded or quantity supplied but not the shortage itself. Both quantities have to be found before subtracting.
The second is subtracting in the wrong order. Quantity demanded is always the larger number under a binding ceiling, so shortage is Qd minus Qs, not the other way around; a negative answer is a sign the two were flipped.
The third is testing the ceiling against the wrong benchmark. The only comparison that matters is the ceiling price against the equilibrium price. A ceiling can look low in dollar terms and still be non-binding if equilibrium happens to be lower still.
Price Ceiling Shortage questions
What happens if a price ceiling is set above the equilibrium price?
Nothing changes. Buyers and sellers were already willing to trade at a lower price, so the market keeps clearing at equilibrium. A price ceiling only affects the market, and only creates a shortage, once it is set below the equilibrium price.
How do you read a shortage off a supply and demand graph?
Draw a horizontal line at the ceiling price. Where that line crosses the demand curve gives quantity demanded; where it crosses the supply curve gives quantity supplied. The shortage is the horizontal gap between those two points, measured along the quantity axis at the ceiling price.
Is the shortage the same size as the deadweight loss?
No. The shortage is a horizontal distance on the quantity axis: quantity demanded minus quantity supplied at the ceiling price. Deadweight loss is a triangle of lost surplus between the demand and supply curves over the units that no longer trade. They come from the same graph but measure different things.
Get AP Econ exam tips in your inbox
Occasional emails with study tips, new interactive graphs, and exam-season reminders. Free, no spam.
No spam. Unsubscribe anytime. Read our privacy policy.
Keep track of what you have studied
A free EconLearn account adds progress tracking, your quiz history, and achievements. Studying here is free either way, and there is nothing to pay for as a student.
Create a free accountAlready have one? Sign in
Last updated