Business Cycle
Loading interactive graph...
Expansions, peaks, contractions, troughs, and economic indicators.
Teaching AP Econ? Assign a graded business cycle activity to your class, auto-graded, scores in your gradebook.
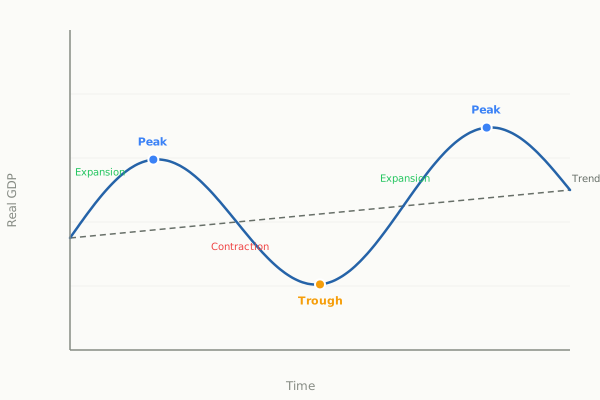
What this graph shows
The business cycle diagram traces how real GDP moves over time around its long-run growth trend. The economy does not grow in a straight line; it moves through four repeating phases. Expansion is when real GDP rises, employment grows, and spending increases. The peak is the high point where output tops out and inflation pressure builds. Contraction is when real GDP falls, and if it lasts two consecutive quarters economists call it a recession. The trough is the low point where unemployment peaks and the recovery begins.
Each phase carries its own indicators, from rising confidence in expansions to the highest unemployment and room for stimulus at the trough. Selecting a phase highlights where it sits on the cycle and lists what the economy looks like there.
How to read it
The horizontal axis is time and the vertical axis is real GDP. The wavy line is actual output, and the straight line running through it is the long-run growth trend, the economy's potential output. Peaks are the local highs above the trend and troughs the local lows below it, with expansions the upward segments between them and contractions the downward ones. Distance above or below the trend line shows whether the economy is overheating or operating below potential.
Three things to try
- Select the Peak phase and read its indicators. Output is at its maximum with very low unemployment and rising inflation, which is why the peak signals overheating rather than a healthy steady state.
- Select the Contraction phase and note that two consecutive quarters of falling GDP defines a recession. Unemployment rises and investment falls as the curve heads toward the trough.
- Select the Trough and then the Expansion in sequence. The trough is the turning point of highest unemployment where recovery starts, and expansion follows as output climbs back toward and above the trend line.
Common questions
What are the four phases of the business cycle?
The four phases are expansion, peak, contraction, and trough. Expansion is rising output, the peak is the high turning point, contraction is falling output, and the trough is the low turning point where recovery begins before a new expansion starts.
What is the difference between a contraction and a recession?
A contraction is any period when real GDP is falling. A recession is a contraction that lasts at least two consecutive quarters, marked by rising unemployment and falling investment. Every recession is a contraction, but a brief dip may not qualify as a recession.
What does the long-run trend line represent on the business cycle?
The straight trend line represents potential output, the level of real GDP the economy produces at full employment over time. Actual GDP fluctuates above it during booms and below it during recessions, and the gap between the two is the output gap.
Put it on your own page: the Business Cycle embed, one line of HTML for a class site or LMS.
Business Cycle: key terms
Full glossary →⧉ Embed this Business Cycle graph on your site
Free to use on any website or class page. Copy the code below, it shows the live, interactive graph and credits EconLearn with a link back.