Monopoly Graph (Monopoly Diagram)
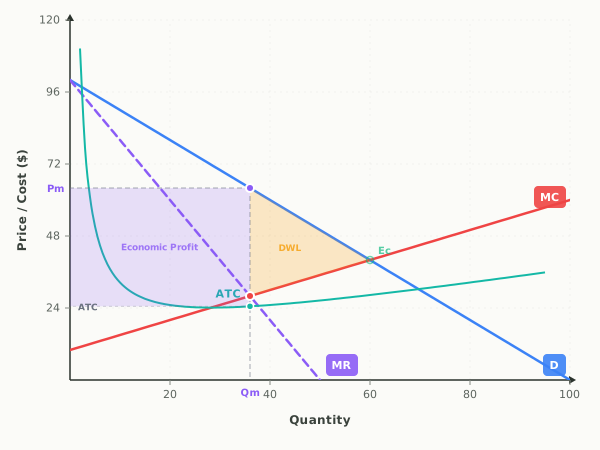
A monopoly graph (monopoly diagram) shows how a single price-making firm chooses output where marginal revenue equals marginal cost and then charges the price on its demand curve above that quantity, a higher price and lower output than a competitive market. The downward demand curve is the firm's own demand, the dashed marginal revenue curve sits below it, the marginal cost curve rises, and the U-shaped average total cost curve shows per-unit cost.
Single-firm pricing, MR below demand, and deadweight loss.
Teaching AP Econ? Assign a graded monopoly activity to your class, auto-graded, scores in your gradebook.
Run it as a class activity: Monopoly Graph Classroom Activities for AP Microeconomics
What this graph shows
The interactive lets you drag the demand and cost curves directly, or use the sliders to change the Demand Intercept and MC Intercept. As you do, the graph recomputes the profit-maximizing quantity, the price the monopoly charges, its economic profit or loss, and the deadweight loss triangle that measures the efficiency the market gives up compared with perfect competition.
How to read it
Price and cost are on the vertical axis, quantity on the horizontal. Solve in two steps: first locate where marginal revenue equals marginal cost, marked by the dot on the MC curve, and drop straight down to read the profit-maximizing quantity Qm. Then go up from Qm to the demand curve and across to the y-axis for the monopoly's price Pm. The shaded rectangle between price and average total cost is economic profit, and the amber triangle out to the competitive point Ec is deadweight loss.
Three things to try
- Drag the Demand Intercept slider higher and watch both the profit-maximizing price and the profit rectangle grow as demand strengthens.
- Lower the MC Intercept slider and watch the profit-max quantity increase; raise it and watch the deadweight loss triangle shrink.
- Compare the purple Pm on the y-axis with the green competitive point Ec, and confirm in the comparison box that the monopoly charges a higher price and sells less than competition would.
Common questions
How do you find the monopoly price and quantity on the graph?
Set quantity where marginal revenue equals marginal cost, then go up to the demand curve to find the price. Quantity comes from the MR equals MC dot, and the price is read off the demand curve directly above that quantity, never off the MR curve.
Why does a monopoly produce where MR equals MC and not where price equals MC?
Producing where marginal revenue equals marginal cost maximizes profit because past that point each extra unit adds more cost than revenue. Price is then set higher by reading up to the demand curve, which is why monopoly output is lower and price is higher than in competition.
What does the deadweight loss triangle on a monopoly graph mean?
The amber triangle shows the mutually beneficial trades that never happen because the monopoly restricts output below the competitive quantity. It measures the total surplus lost to society from monopoly pricing.
How do you draw a monopoly diagram?
Put price and cost on the vertical axis and quantity on the horizontal axis. Draw a downward-sloping demand curve, a marginal revenue curve below it, an upward-sloping MC curve, and a U-shaped ATC curve. Find the quantity where MR equals MC, go up to the demand curve for the price, and shade the rectangle between that price and ATC at that quantity: economic profit if price is above ATC, a loss if ATC is above price.
Why is the marginal revenue curve below demand on a monopoly graph?
A monopoly must lower its price on every unit to sell one more, so the extra revenue from the last unit is less than its price. That puts MR below the demand curve at every quantity after the first. For a straight-line demand curve, MR starts at the same price intercept and falls twice as steeply.
Put it on your own page: the Monopoly embed, one line of HTML for a class site or LMS.
Monopoly: key terms
Full glossary →⧉ Embed this Monopoly graph on your site
Free to use on any website or class page. Copy the code below to show the live, interactive graph. The credit line at the end is optional.
Last updated