International Trade graph mistakes
3 ways students lose points on this diagram, each taken from a worked free-response scenario. Every entry names the reasoning that causes the error, not just the error, because the wrong answer is usually a sensible thought applied to the wrong curve.
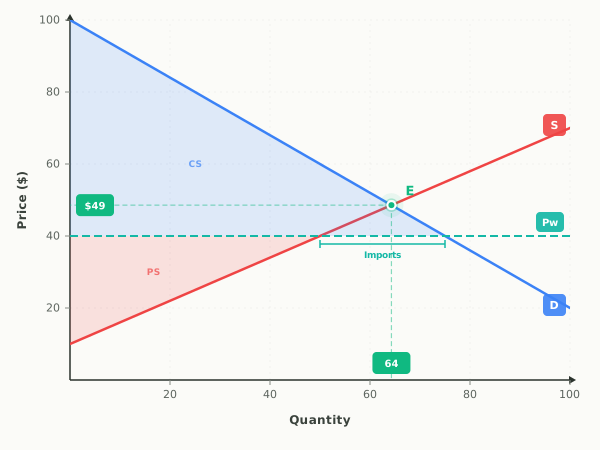
- 01
Steel Import Duty: what do students get wrong on the International Trade graph?
The mistake. Many students shift domestic supply to the right, reasoning that protection means home mills produce more. Home mills do produce more, but that is a movement up along an unchanged supply curve, pulled out by the higher price the policy creates. A tariff changes the price line that domestic buyers and sellers face; it does not cut any mill's costs, so the supply curve itself never moves.
Draw this instead. The tariff shifts up.
Exam tip. Draw a second horizontal line one tariff above the world price line, read the new domestic quantities off the two curves where they cross it, and remember that the gap between those quantities is imports and the revenue rectangle sits on top of it.
Try this one on a live graph - 02
Global Wheat Glut: what do students get wrong on the International Trade graph?
The mistake. Students often shift domestic supply to the right, since the extra wheat is real enough. The harvest happened in other countries, so it changes the price Ostvale faces rather than what Ostvale's own farmers can grow at each price. Domestic farmers slide down their unchanged supply curve, and the only thing that moves is the world price line, which moves down.
Draw this instead. The world price (Pw) shifts down.
Exam tip. On a small-country trade graph, foreign events move the horizontal world price line while domestic events move the sloped curves. Imports are the horizontal gap between the two domestic curves measured at that price line, so a lower line always means wider imports.
Try this one on a live graph - 03
World Incomes and Coffee: what do students get wrong on the International Trade graph?
The mistake. The word "incomes" pulls many students into shifting Larenne's domestic demand curve to the right. The incomes that rose belong to consumers in other countries, and those consumers buy in the world market, not on this graph. Their extra buying reaches Larenne only through the price it must pay, so the world price moves up and Larenne's own buyers slide up an unchanged demand curve.
Draw this instead. The world price (Pw) shifts up.
Exam tip. Ask whose behavior changed and where those people buy. A change among foreign buyers or foreign sellers moves only the world price line; a change among the graphed country's own households or firms is what moves a domestic curve.
Try this one on a live graph
Mistakes on the other graphs
- Supply and Demand
- AD-AS Model
- Money Market
- Loanable Funds Market
- Foreign Exchange Market (USD)
- Phillips Curve
- Labor Market
- Fiscal Policy (AD-AS)
- Production Possibilities
Looking for exam-wide advice rather than one diagram? The ten most common AP Economics exam mistakes covers timing, command verbs, and the errors that are not about graphs at all.
Last updated