What are three things a PPC shows?
A production possibilities curve shows three things: scarcity, since it sits on a fixed frontier for two goods; opportunity cost, read as the slope between two points; and efficiency, since only points on the curve use every resource fully. A shifting curve adds growth.
Full guide: The PPC, explained with graphs and examples
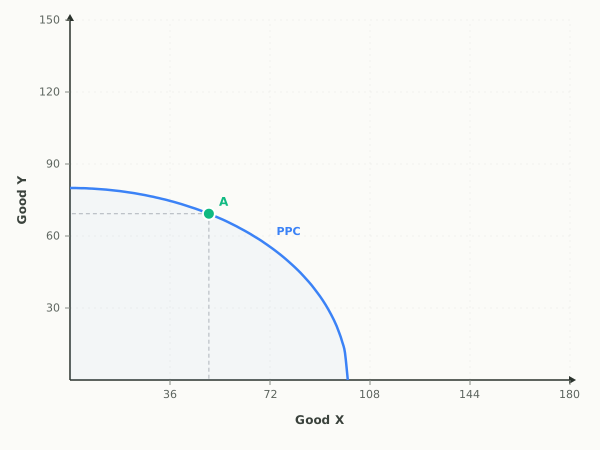
A production possibilities curve (PPC) shows the maximum combinations of two goods an economy can produce when it fully uses its limited resources with current technology, and that one diagram carries three core ideas: scarcity, opportunity cost, and efficiency. A fourth idea, economic growth, shows up not on the curve itself but when the whole curve moves. Each idea maps to a specific feature of the graph rather than to the picture as a whole, which is why the PPC rewards reading it piece by piece instead of memorizing it as one shape.
Scarcity shows up as the frontier itself. The curve is the outer boundary of every combination of two goods, say wheat and phones, that an economy can produce when it uses all of its resources fully and with current technology. Because the frontier stops rather than continuing forever, the graph is a direct statement that resources are limited: no point beyond the curve is reachable today, no matter how badly it is wanted.
Opportunity cost shows up as the slope between any two points on the curve. Moving along the frontier to produce more of one good means giving up some of the other, and the amount given up per unit gained is the opportunity cost. Suppose an economy moves along its PPC from 100 tons of wheat and 5 phones to 70 tons of wheat and 10 phones. Wheat fell by 30 tons while phones rose by 5, so the opportunity cost of one phone is 30 divided by 5, or 6 tons of wheat. Read the same two points the other way and the opportunity cost of one ton of wheat is 5 divided by 30, or about 0.17 phones. The curve usually bows outward because that opportunity cost keeps rising as production shifts further toward one good, a pattern called the law of increasing opportunity cost.
Efficiency shows up as the difference between points on, inside, and outside the curve. A point sitting on the curve is productively efficient: every resource is in use, so producing more of one good requires giving up some of the other. A point inside the curve, for example 70 tons of wheat and 5 phones when the frontier allows 70 tons of wheat and 10 phones at that same wheat level, is inefficient. Resources are idle or misallocated, so the economy could produce 5 more phones without sacrificing any wheat at all. A point outside the curve is unattainable with today's resources, full stop, until something changes the frontier itself.
Growth is the idea a shifting curve adds. All three ideas above describe one fixed frontier, but the frontier itself moves when the underlying resources change. More labor, more capital, better technology, or a more skilled workforce pushes the whole curve outward, so the economy can produce more of both goods than before, for example the wheat-phone frontier moving from a maximum of 110 tons of wheat to a maximum of 140 tons of wheat with no change in the maximum number of phones. A war or a natural disaster that destroys factories does the opposite, pulling the curve inward. Growth is a statement about the whole graph changing shape, not about where a single point sits on a fixed one.
For the full walkthrough, including why most PPCs bow outward and how the curve connects to comparative advantage, see the production possibilities curve explained. To practice turning two points on a curve into a clean opportunity cost ratio, work through the opportunity cost calculator.
Go deeper
Related questions
- Does a PPC only work with two goods?
- Yes, by design. Plotting two goods on two axes is what makes the frontier drawable and the slope readable as opportunity cost. Real economies produce far more than two goods, so the model treats one axis as a stand-in for one good and the other axis for everything else.
- What is the fourth idea a shifting PPC illustrates?
- Economic growth. A single PPC only describes points relative to one fixed frontier, so growth needs the frontier itself to move outward, which happens with more resources, better technology, or a more skilled workforce.
- How is opportunity cost read directly off a PPC?
- Take two points on the curve and divide what is given up by what is gained. Between two points where good X rises by 4 units and good Y falls by 12 units, the opportunity cost of one unit of X is 12 divided by 4, or 3 units of Y.
- What does a PPC show about an economy's resources and production?
- It shows the maximum output of two goods an economy can produce when it uses all of its resources fully with current technology. Because resources are limited, producing more of one good means producing less of the other; points inside the curve mean resources are idle or misallocated, and points outside are unattainable until resources or technology grow.
More questions answered
Last updated