What does PPC stand for in economics?
PPC stands for production possibilities curve, also called the production possibilities frontier. It is the graph showing the maximum combinations of two goods an economy can produce when every resource is fully and efficiently employed.
Full guide: The PPC, explained with graphs and examples
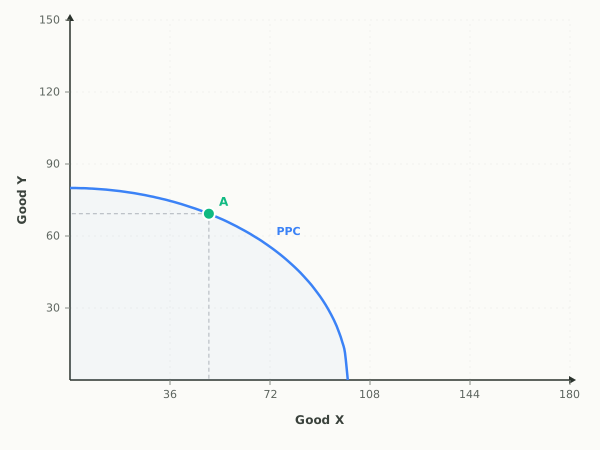
A PPC is drawn as a single line on a graph with one good on each axis, for example tractors on the horizontal axis and bread on the vertical axis. Every point on that line is a combination of the two goods the economy can produce at full employment. The line is often drawn bowed outward, away from the origin, to show increasing opportunity cost, though some versions, especially in comparative advantage and trade problems, use a straight line to show constant opportunity cost instead. Both are standard AP models, just illustrating different assumptions about how resources shift between the two goods.
The bow happens because resources are not equally good at producing both goods. Moving from all bread to a little tractors first pulls in workers who were already mediocre at baking, so the economy gives up very little bread for the first few tractors. Producing more tractors keeps pulling in workers and land that were genuinely good at making bread, so each additional tractor costs more and more bread. That rising cost is called increasing opportunity cost, and the bowed shape is simply that rising cost drawn as a picture.
Where a point sits relative to the curve tells you the state of the economy. A point on the curve is efficient: every resource is employed and nothing is wasted. A point inside the curve is attainable but inefficient, meaning resources sit idle through unemployment, an idle factory, or a resource left unused, so output could rise without adding anything new. A point outside the curve is unattainable right now, since it would require more resources or better technology than the economy currently has.
Three ideas anchor almost everything a PPC question asks. First, scarcity forces the tradeoff in the first place, since an economy sitting on the curve can only get more of one good by giving up some of the other. Second, the slope of the curve at any point is the opportunity cost of that good, and the increasing steepness moving along the curve is what makes the shape bow. Third, economic growth shifts the entire curve outward, from new technology, more workers, or more capital, while a point simply moving along an unchanged curve is a choice between goods, not growth.
The production possibilities curve explained walks through the constant-cost straight-line version, the full labeling an exam expects, and worked practice reading opportunity cost off the graph. The production possibilities curve glossary entry gives the short formal definition to cite directly on a free-response answer.
Go deeper
Related questions
- Is PPC the same as PPF?
- Yes. Production possibilities curve and production possibilities frontier name the same graph, and both abbreviate to the same idea. Some textbooks use PPC, others use PPF, and AP exam questions accept either term.
- Why does the PPC bow outward instead of forming a straight line?
- A straight line would mean every resource is equally suited to producing both goods, so opportunity cost stays constant. A bowed curve reflects the more realistic case where resources specialize, so opportunity cost rises as an economy shifts more resources toward one good.
- What does a point inside the PPC mean?
- A point inside the curve means the economy could produce more of both goods without giving up either, because some resources sit unused. Common causes include unemployment, idle factories, or a recession, and the fix is putting existing resources back to work rather than acquiring new ones.
- Does moving along the PPC count as economic growth?
- No. Moving along an unchanged curve is a choice to produce more of one good and less of the other, using the same total resources. Growth requires the whole curve to shift outward, which needs new resources, more workers, or better technology.
More questions answered
Last updated